Chrome DevTools supports remote debugging of web pages and WebView applications on Android devices. This feature is invaluable for mobile front-end development and hybrid app development, allowing you to use the full suite of desktop Chrome DevTools to debug mobile pages.
Requirements
- Chrome 32+ installed on your development machine
- A USB cable to connect your Android device
- For browser debugging: Android 4.0+ and Chrome for Android
- For WebView debugging: Android 4.4+ (KitKat) with WebView configured for debugging
Step-by-step Guide
1. Connect Your Device
Enable Developer Options on your device (Settings > About Phone > tap Build Number repeatedly), ensure USB debugging is enabled, and connect via USB.
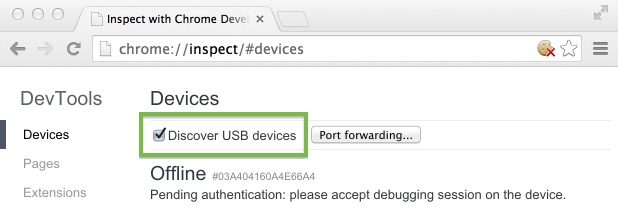
2. Open chrome://inspect
Navigate to chrome://inspect in desktop Chrome and verify that Discover USB devices is checked. On first connection, your device may show an authorization prompt — tap OK.
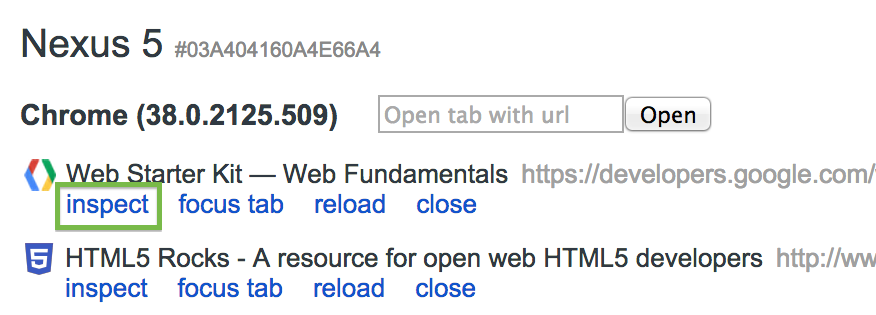
3. Inspect Browser Tabs
Chrome will list open tabs from your device. Click inspect to open DevTools.
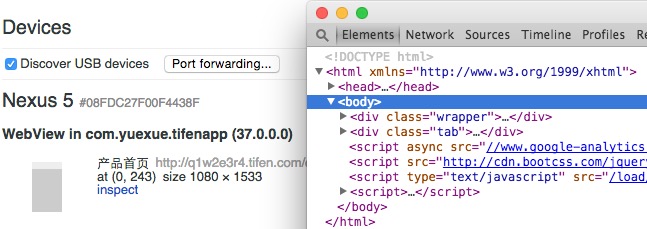
4. Debug WebViews in Your App
To enable WebView debugging in your app, add this code:
| |
It’s recommended to guard this with a debug-build check or compile-time flag for production builds.
5. Screencast
Click the Screencast icon in DevTools to see the device screen in real-time and interact with it directly from your desktop.
![]()
Debugging Tips
- Press F5 (or Cmd+R on Mac) to reload a remote page from DevTools
- Use the Network panel to view the waterfall under actual mobile cellular conditions
- Use the Timeline panel to analyze rendering and CPU usage — mobile hardware is significantly slower than your development machine
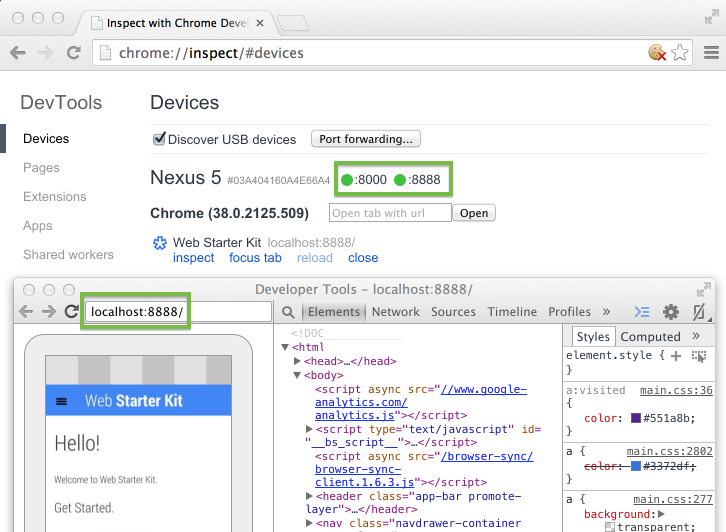
- If your device can’t reach your development server, use Port Forwarding or Virtual Host Mapping
Port Forwarding
Your phone often can’t reach your development server directly (different networks, corporate VPN, etc.). Port forwarding creates a TCP listener on your device that tunnels traffic through USB to your development machine.
Steps:
- Open
chrome://inspect - Click Port Forwarding
- Set Device port (default 8080) — the port your device will listen on
- Set Host to your dev server’s IP and port (port must be 1024-65535)
- Check Enable port forwarding
- Click Done
Virtual Host Mapping
For debugging with custom domain names:
- Install a proxy on your dev machine (e.g., Charles Proxy or Squid)
- Configure port forwarding: Device port = 9000, Host =
localhost:<proxy-port> - Configure the Android device’s Wi-Fi proxy to
localhost:9000
Troubleshooting
Device not appearing in chrome://inspect
- Windows: install the correct USB driver — see OEM USB Drivers
- Connect the device directly (not through a USB hub)
- Verify USB debugging is enabled and authorized on the device
- Desktop Chrome version must be newer than Chrome for Android on the device; try Chrome Canary
- If still failing: revoke USB debugging authorizations on the device and reconnect
Browser tabs not showing
- Open Chrome on the device and load the page first, then refresh
chrome://inspect
WebViews not showing
- Confirm
setWebContentsDebuggingEnabled(true)is called in your app - Open the app with the WebView on the device, then refresh
chrome://inspect
Can’t access dev server from device
- Use port forwarding or set up a virtual host mapping
As a last resort, you can fall back to the legacy adb workflow.